Telemetry
Tilegroxy supports utilizing OpenTelemetry (OTEL) to provide portable observability. This allows you to monitor and "observe" your tilegroxy deployment in tools such as Fluent Bit, CloudWatch, NewRelic, Dynatrace, etc.
The supported telemetry data includes metrics, logs, and traces. These are disabled by default and can be turned on by setting telemetry.enabled to true in your configuration or TELEMETRY_ENABLED=true via environment variable. Tilegroxy only supports the HTTP exporter, not STDOUT or GRPC. Once telemetry is enabled you will need to use standard OTEL environment variables to point the HTTP exporter to your collector. For example: OTEL_EXPORTER_OTLP_ENDPOINT="http://localhost:4318".
|
Logs
The "main" application logs will be shipped to OTEL in addition to the destinations specified in the configuration. Access logs are not shipped to OTEL.
Metrics
Metrics are available for cache hit/miss and the number of tile requests broken down by status. The full list of metrics:
| Metric | Description |
|---|---|
|
The total number of tile requests received by tilegroxy |
|
The number of tile requests received by tilegroxy that pass validation and authentication checks |
|
The number of tile requests that result in an error excluding validation and authentication |
|
The number of tiles requests that result in a successful response - this includes when a fallback kicks in |
|
The number of requests processed against the indicated layer |
|
The number of errors that occur trying to generate a tile for the indicated layer |
|
The number of tile successfully generated for the indicated layer |
|
The number of outgoing authentication checks performed for the indicated layer |
|
The number of cache lookups that result in a tile |
|
The number of cache lookups that don’t result in a tile |
|
The number of analytics events successfully written to a destination |
|
The number of analytics events discarded because a module’s queue was full |
|
The number of analytics events in batches that failed to write |
|
Provided by otelhttp. Reflects the size of responses bodies returned from tilegroxy in bytes |
|
Provided by otelhttp. Reflects the size of request bodies sent to tilegroxy in bytes |
|
Provided by otelhttp. Reflects the time tilegroxy spends processing a request |
|
Provided by otelhttp. Reflects the time tilegroxy waits on requests to external APIs |
|
Provided by otelhttp. Reflects the size of responses bodies from external APIs called by tilegroxy in bytes |
|
Provided by otelhttp. Reflects the size of request bodies sent to external APIs by tilegroxy in bytes |
When using patterns with layers, metrics are logged against the ID of the layer not the name passed into the URL. If using a Ref provider (including indirectly via the Blend provider), the "child" layer requests are recorded in the layer-specific metrics but not the total metrics.
The layer ID is sanitized to only alphanumeric characters, underscores, and hyphens; everything else is replaced with underscores. It is also truncated to 200 characters to leave room for the metric name around it. This keeps the instrument name valid for OTEL. Either step can cause collisions, so usage for "my.layer" and "my_layer" will get written to the same metrics.
The tilegroxy.analytics.* metrics are meant to help monitor the health of Analytics delivery. A spike in dropped or error count means usage tracking is getting dropped, so it’s worth alerting on these separately.
Traces
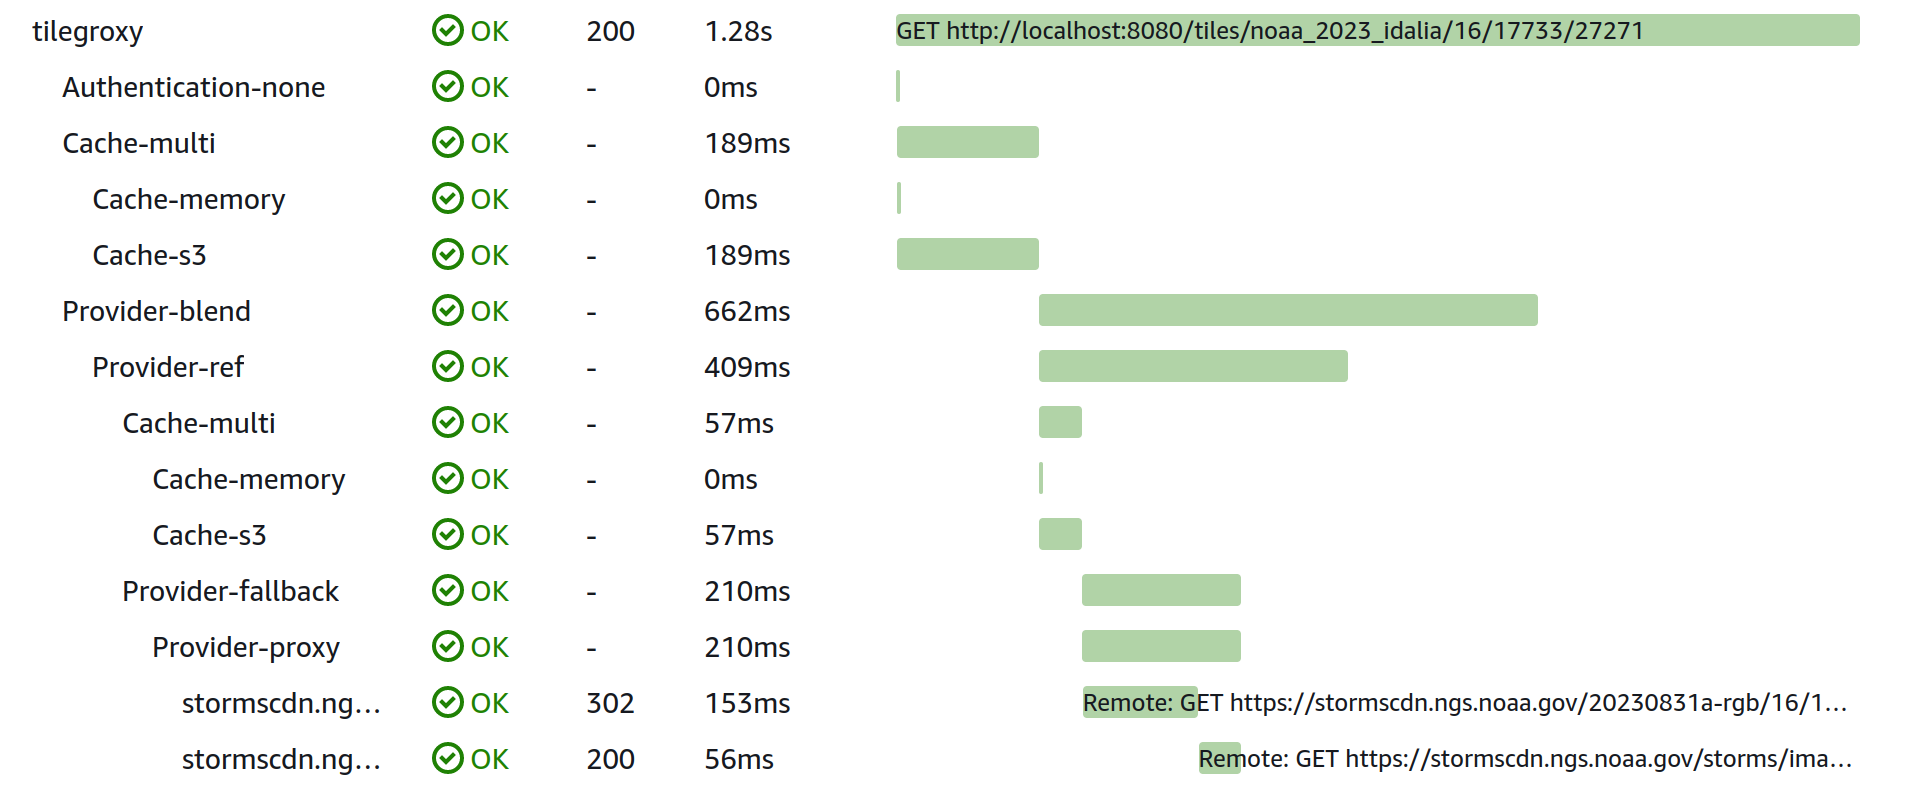
Traces are generated for all incoming requests into tilegroxy. For tile requests we include a parent span named "tilegroxy" that then includes child spans for providers, authentication, and cache. Additionally child spans are generated for outgoing HTTP requests. Utilizing these spans allows you to see a breakdown of where time is spent for a given request and where errors occur, this is especially useful for complicated layer setups.